The automatic biochemical analyzer is an instrument that automates the steps of sampling, adding reagents, removing interference substances, mixing, constant temperature reaction, automatic monitoring, data processing and post-experiment cleaning in biochemical analysis. It completely imitates and replaces manual operations. Operation has now become one of the indispensable instruments for clinical diagnosis in medical institutions. Its application has greatly improved the accuracy, precision and work efficiency of biochemical testing, and adapted to the requirements of clinical medicine development for laboratory medicine. However, all of this requires not only the technical foundation of the biochemical analyzer, but also the technical foundation of each item in the instrument. set of optimized analysis parameters. And most of the current biochemical analyzers are open-type. Closed-type instruments generally leave some blank channels for test items for users to set the analysis parameters themselves. Therefore, it is necessary for us to understand the basic meaning and settings of each analysis parameter of the biochemical analyzer. method.
1, test name
It is often set by the English abbreviation of the project, such as total protein is set to TP, albumin is set to ALB, etc.
2. Method type
Commonly used methods for biochemical analyzers include endpoint method, continuous monitoring method, turbidimetric method, etc. One of the analysis methods should be selected based on the detection principle of the substance being tested.
2.1 The end-point method, also known as the equilibrium method, is a method for quantitative analysis of substances based on the absorption spectral characteristics of the reaction product and its light absorption intensity when the reaction reaches equilibrium. There are two types: one-point end-point method and two-point end-point method. . The characteristic of the one-point end point method is to use one or two reagents. When the reaction between the substance to be tested and the reagent reaches the end point, the absorbance of the mixed solution is measured to calculate the concentration of the substance to be tested. Commonly used methods include the total protein biuret method, Most manual methods such as albumin bromocresol green method and glucose oxidase method are one-point endpoint methods. The two-point end-point method is also called the fixed time method. If it is a single-reagent analysis, when the measurement wavelength overlaps with the absorption spectrum of the interfering substance, the interference caused by the sample blank can be eliminated by selecting the two-point end-point method. The analysis process is between the sample and the interference substance. After the reagents are mixed, read a point A1 after a delay period, and then read A2 after a certain period of time. Then compare the standard and measured ΔA (ΔA=A2-A1) values to obtain the concentration of the test substance. The creatinine picric acid method is a typical example of a single-reagent two-point method. If it is a dual-reagent analysis, the two-point end-point analysis method can not only eliminate the interference caused by the sample blank, but also eliminate the interference of endogenous interfering substances. The analysis process is to read A1 after adding reagent 1, and read after adding reagent 2. Take A2, A1 is equivalent to reading the blank value of the sample, A2 is the actual color reaction, and then compare the standard and measured ΔA (ΔA=A2-A1) values to find the concentration of the test substance. In order to improve the accuracy of end-point method detection, two analysis parameters such as end-point method zero reading and sample blank should be set when selecting this method. The former starts reading before the reaction, and can deduct the blank reading of the reagent and sample mixture before the reaction; The latter is the absorbance obtained by adding blank reagent to the sample, and the reaction requires a cuvette.
2.2 Continuous monitoring method is also called dynamic analysis method, rate method, etc. The basic principle is to use physical, chemical or enzymatic reaction analysis methods under the optimal conditions of enzymatic reaction, and in the constant reaction rate period (zero-order reaction period) Continuously observe and record the changes in the amount of substrate or product within a certain reaction time, and calculate the enzyme activity and the concentration of metabolites based on the initial speed of the enzyme reaction per unit time. Specific methods include two-point rate method and multi-point rate method: The two-point rate method is to observe the absorbance at two time points during the zero-order reaction period, and divide the absorbance difference (ΔA) of the two points by the time (minutes). ), calculate the absorbance change value per minute; the multi-point rate method is to monitor every certain time (2-30s) during the zero-order reaction period, and continuously monitor multiple times to calculate the reaction speed per unit time, which This method can be divided into least squares method, multi-point delta method, regression method, rate time method, etc. The obvious advantage of this method is that it greatly improves the analysis speed and accuracy, and is mainly suitable for the determination of enzyme activity and its metabolites. During the continuous monitoring method, even if no sample is added, the substrate in the reagent will automatically degrade to obtain a result. Therefore, the reagent blank rate should be set. The reagent blank rate of different batches of reagents is different. The value is measured by using water instead of sample. The obtained project results and sample measurement results should be deducted from the value of the reagent blank rate.
2.3 Turbidimetric automatic biochemical analyzers generally can only perform transmission immunoturbidimetric analysis. When light passes through a certain volume of solution containing immune complexes, due to the reflection and absorption of light by the antigen-antibody complex particles present in the solution, Causes a reduction in transmitted light, and the measured light flux is inversely proportional to the amount of antigen-antibody complexes. It is often used for endpoint determination, and is currently mainly used for the detection of serum special proteins, such as apolipoproteins, trace proteins, acute phase reaction proteins, immunoglobulins, and certain drug monitoring. However, if the concentration of the antigen to be tested in the sample is too high, the immune complex molecules formed by the antigen and the antibody will become smaller and prone to dissociation, causing the turbidity to decrease instead. Therefore, a front zone inspection must be set up during the immunoturbidimetric analysis process. Compare the difference between the last two reading points during the analysis. If the absorbance of the latter point is lower than that of the previous point, it means there is excess antigen, and the sample should be diluted and retested.
3. Reaction temperature
The automatic biochemical analyzer keeps the temperature constant through the temperature control system to ensure the normal progress of the reaction. There are three ways to maintain constant temperature: dry thermostat heating, water bath circulation heating, and thermostat circulation indirect heating. The thermostat can control three temperatures: 25°C, 30°C, and 37°C. You can choose any of them according to your needs. Semi-automatic biochemical analyzer thermostats fall into this category. The temperature controller of a fully automatic biochemical analyzer can generally only control one temperature, 37°C, and a few can also control two temperatures, 30°C and 37°C.
4. Reaction wavelength
When there is only one component in the measurement system or the absorption peak of the component to be measured in the mixed solution does not overlap with the absorption wavelength of other coexisting substances, a single wavelength can be used. If the substance to be measured has several absorption peaks, the maximum absorbance can be used. a wavelength, or choose a wavelength where the absorbance changes less with wavelength at the absorption peak. When the solution to be tested is turbid or there are many interfering substances, light scattering and non-specific light absorption will occur during the measurement process, thus affecting the accuracy of the measurement results. At this time, dual-wavelength or even multi-wavelength measurement can be used to improve the accuracy of the measurement results. Accuracy, and in practical applications, the selection of auxiliary wavelengths is mainly used to eliminate the interference of lipemia, hemolysis, and jaundice. Since lipids, hemoglobin, and bilirubin have strong light absorption in a wide wavelength range and often overlap with the measurement wavelength, the measured absorbance at this time includes the absorbance of the substance to be measured and the absorbance of the interfering substance, so it must Select an appropriate auxiliary wavelength to eliminate the absorbance of interfering substances. The setting principle of the auxiliary wavelength is to select the auxiliary wavelength according to the measurement wavelength, and the interfering substance is required to have the same absorbance at the measurement wavelength and the auxiliary wavelength.
5.Reaction direction
There are two types: forward reaction and negative reaction. During the reaction, the absorbance increases, which is the forward reaction, and the absorbance decreases, which is the negative reaction.
6. Sample size and reagent amount
The amount of sample and reagent is generally determined according to the ratio in the reagent instructions and combined with the characteristics of the instrument. It can also be scaled down or redesigned according to manual methods. However, the detection sensitivity and linear range must be taken into consideration, and the sample dilution factor should be diluted as much as possible. larger to reduce the influence of other components in the sample. During the setting process of sample and reagent amounts, the following aspects should be paid attention to: ① Amount of dilution water. The purpose of adding sample dilution water is to wash out the trace amounts of serum adhering to the inner wall of the sampling needle and reduce sampling errors. Add reagent dilution water. In order to avoid cross-contamination between reagents, the amounts of the two dilution waters should be deducted in proportion when reconstituting the reagents. If a liquid kit is used, the amount of dilution water cannot be deducted because no water is used, so the two types of dilution water should be reduced as much as possible to avoid excessive dilution of the reagent. ② Minimum sample volume, that is, the minimum sample volume that the analyzer syringe can absorb within the specified error range. With the continuous improvement of technology, the minimum sample volume of the instrument has gradually decreased, and is currently as low as 1.6 μl. When the sample contains high concentrations of metabolites or high active enzyme concentrations, it is often necessary to use the minimum sample volume of the analyzer as the reduction parameter, thereby expanding the upper limit of the instrument's detection range. ③The total reaction capacity has a different specified range in different analyzers. When setting, the sum of sample volume and reagent volume cannot exceed this range. This value is affected by the optical path system of the instrument. The direct optical path has a wide beam and is difficult to reduce the volume of the reaction solution being tested. The clustered optical path narrows the beam through a lens and can detect reaction solution mixtures as low as 180 μl. In recent years, point light source technology has emerged. Its beam is smaller and only illuminates a point when it hits the sample cup, which can reduce the amount of reaction solution to 120 μl. ④ Reagent volume/sample volume ratio. Do not reduce reagent volume excessively in order to save reagents, because in the end-point colorimetric method, reducing the reagent volume/sample volume ratio will reduce the linear range. In the case of high concentration samples, insufficient reagent volume will result. The results are on the low side.
7. Analysis time
Analysis time includes incubation time, delay time, monitoring time, etc. When choosing different analysis methods, you should choose the corresponding analysis time.
7.1 The incubation time is set when selecting the end-point method. In the one-point end-point method, it is the time from the start of mixing the sample and reagent to the end of the reaction. In the two-point end-point method, it is the time from the first absorbance selection point to the second absorbance selection point. . When setting the incubation time, special attention should be paid to some analysis methods. For example, when choosing the bromocresol green method to measure serum albumin, α1-globulin, transferrin, etc. in the serum can also color with bromocresol green, although they The reaction rate is slower than that of albumin, but in fact when serum is mixed with albumin, a "slow reaction" has already occurred. Therefore, in order to reduce non-specific binding reactions, the absorbance should be read 30 seconds after bromocresol green is mixed with serum. When choosing the enzymatic Trinder reaction to measure glucose, total cholesterol, and triglycerides, since the enzyme reaction at 37°C is slow, it is necessary to measure the time it takes for these enzyme reagent reactions to reach the end point. The kit for the automatic analyzer can generally add all samples The reaction is complete within 5 minutes, so the maximum reaction time of the analyzer should be selected.
7.2 Delay time is set when the continuous monitoring method or the two-point end point method is selected, that is, the time between the start of mixing the sample and the reaction reagent (second reagent) to the first absorbance selection point. During the continuous monitoring method, it takes a certain amount of time for the enzyme to activate after the enzyme is mixed with the substrate, and monitoring cannot begin until the linear reaction period. Some projects require the use of tool enzymes to deplete endogenous metabolites and eliminate interference. Generally, the single-reagent method only takes 30 seconds. In commonly used projects, glutamate aminotransferase and aspartate aminotransferase require special attention. However, for dual-substrate reactions or requiring coenzyme participants, it usually takes 1-3 minutes.
7.3 Monitoring time After the lag period of the enzymatic reaction, in the presence of excess substrate, the reaction rate accelerates and reaches a stable stage, that is, the enzymatic reaction proceeds at a constant rate and is not affected by the substrate concentration. This period is called The linear reaction period or zero-order reaction period is the monitoring time of the automatic biochemical analyzer. The continuous monitoring method should monitor at least 90-120s or at least 4 points (3 ΔA) during the zero-order reaction period. Less than 3 ΔA cannot be called a continuous monitoring method because linearity cannot be calculated; if the monitoring time is too long, bottoming will easily occur. When the material is exhausted, the measurable range becomes narrower.
8. Calculation factor
(F value) and measured F value. When measuring enzyme activity using the continuous monitoring method, there is no need to make a standard tube or standard curve. The enzyme activity concentration can be easily calculated based on the molar absorption coefficient. First measure the change in absorbance per minute (ΔA/min) within the linear range. When U/L represents the enzyme activity concentration, it can be calculated according to the following formula:
U/L, t℃=△A/min×F==△A/min×V×106/(ε×V×L)
In the formula, V: the total volume of the reaction system (ml); 106: convert mol to μmol; ε: molar absorption coefficient (cm2/mol); v: sample volume (ml); L: optical path of the cuvette (cm).
When the conditions are fixed, theoretically V, v and L are all fixed values, and the ε value is a constant, so the F value is constant. The F value is very important for the determination of enzymes. If it is too high, the linearity of the measurement will be wider, but the repeatability will be poor. On the contrary, although the precision will be good, the detection linearity will be narrow, so reasonable settings and applications should be made based on the actual situation. However, in clinical practice, many factors of the instrument, such as the accuracy of the wavelength, the size of the half-wave width, the optical path of the cuvette, wear and cleanliness, the accuracy of the temperature control, the condition of the sample addition system, etc., may fail to meet the requirements or occur. Changes will affect the ε value of the indicator or the related terms in the above formula. Therefore, the measured ε value and F value of the indicator should be regularly checked and measured under specific instrument conditions. Because pure NAD(P)H solution is unstable, the ε value of NAD(P)H needs to be measured using the glucose hexokinase method. The actual operation is to repeat the measurement of a certain concentration of glucose solution 5-10 times to obtain the corresponding value. Set the absorbance A value and calculate A¯ ±s. Note that s must be lower than the specified intra-batch allowable value. Then calculate the measured ε value and F value of NAD(P)H according to the following two formulas:
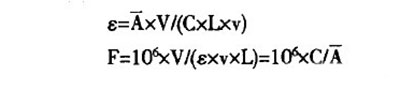
In the formula, C is the concentration of standard solution (mol/L). The ε values of some other pigment source indicators will change to varying degrees in different media environments, such as 5-thio-2-nitrobenzoic acid, p-nitrophenol, and p-nitroaniline. A high-purity and stable indicator can be prepared in a certain medium, and the absorbance is measured according to the on-site reagents and instruments used for clinical specimens to obtain the actual measured ε value and F value.
9. Linearity
Is the boundary of the nonlinear ratio, commonly expressed as %, and its calculation formula is, where: k1 is the slope of the first reading time within 2/3 of the continuous monitoring time, k2 is the slope of the last 2/3 reading time, k3 is the total slope, Generally set to 15%. For some enzyme activity items, it can be relaxed appropriately. When there is no need to set the check limit, set it to 0. A large linear percentage indicates that Δk is no longer linear; exceeding the limit value indicates that the substrate is insufficient, and the detection result will become lower, and the test should be retested after dilution.
10. Substrate depletion limit
Set when selecting the continuous monitoring method or the two-point end point method. Different models of analyzers have different designs. Some are the difference between the absorbance at the zero point and the first point monitored, and some are the absorbance rising or falling to the specified absorbance (MAX-OD/MIN -OD) value. Exceeding the limit indicates that the enzyme activity of the sample is very high and the substrate is consumed too quickly. The change in absorbance within the linear reaction period specified by the instrument program often does not represent the true enzyme activity, resulting in a low result. The sample should be diluted by a certain multiple and remeasured. . This parameter is very important for the method of using negative reaction to analyze enzyme activity. The following takes alanine aminotransferase as an example to briefly describe the steps of setting MIN-OD. Select a mixed serum of highly active enzymes and dilute it with physiological saline to obtain A set of alanine aminotransferase solutions ranging from low concentration to high concentration; measure this set of solutions according to the program set by the instrument, and print out the reaction curve; from the curve, it can be found that when the enzyme activity reaches a certain critical concentration, The response curve of the critical concentration is linear during the continuous monitoring time, but becomes nonlinear after the monitoring time. That is, the last reading point of the continuous monitoring time is exactly the critical point between linearity and nonlinearity, so the absorbance at this point is continuously The minimum absorbance value that can be achieved when the enzymatic reaction does not deplete the substrate within the monitoring time. This minimum absorbance value is also the MIN-OD. When the enzyme activity is higher than the above critical concentration, the reaction curve no longer shows a linear response during the continuous monitoring period. Some instruments automatically select the elastic rate function, which can automatically select the absorbance data calculation results on the reaction curve that are still linear during the continuous monitoring period. The linear range of enzyme activity measurement can be expanded, which can reduce the number of dilutions and retests and reduce costs.
11. Upper limit and lower limit of reagent absorbance
The upper limit of the absorbance of the reagent is for the forward reaction. You can refer to the kit instructions to convert the value into the optical path of the cuvette used. If the upper limit required by the kit is 0.4 and the optical diameter of the cuvette is 0.6cm, then the upper limit of the absorbance of the reagent is set to 0.24. The lower limit of reagent absorbance is for negative reactions, and the setting method is the same as the upper limit of reagent absorbance. Each reagent has a certain blank absorbance range. Changes in the blank absorbance of a reagent often indicate the deterioration of the reagent. At this time, qualified reagents should be replaced.
12. Linear range
The linear range of the kit is related to the reagent quality and the reagent/sample ratio during the reaction. The linear range of the kit should be tested. When the sample concentration is lower than the linear lower limit, the sample amount should be increased and retested; if it is higher than the linear upper limit, the sample should be diluted and retested. When using any method to measure a analyte, the analyte has a measurable concentration or activity range. If the sample result exceeds this range, the instrument will display a prompt that the measurement result exceeds the linear range. Most analyzers will automatically Reduce or increment the sample and re-measure.
13. Correction method
Calibration methods for settings within the instrument generally include two-point correction, multi-point correction, nonlinear correction, etc. Two-point calibration refers to a method of calibration using a concentration of standard and a reagent blank. This method requires that the reaction must comply with Lambert-Beer's law, that is, the standard curve should be a straight line. Multi-point calibration is a nonlinear method for calibrating multiple standards with concentration gradients. It is suitable for projects with standard curves in various curve forms, such as most immunoturbidity methods. Nonlinear correction includes logarithmic correction, exponential correction, ranging method correction, etc. Items with standard curves that exhibit logarithmic or exponential curve characteristics can choose the corresponding method for correction. The measuring range method is based on the concentration and absorbance between each two points on the standard curve. Calculate the concentration of the analyte based on the relationship.
14. Linear regression equation
It is used to calibrate the consistency of measurement results between different analysis methods. It can be obtained after calibration. It has two parameters: slope and intercept. a is the intercept of the curve on the vertical axis, and b is the slope of the curve.
In addition, there are analysis parameters such as project code, decimal point, measurement unit, normal reference value, etc., which can be set according to the actual situation. Properly setting various analysis parameters is one of the most important parts of using a biochemical analyzer. It is also the key to whether the operator can correctly control the instrument to complete a series of complex and orderly operating procedures. As inspection workers in the new century, we have It is necessary to master these technologies.